If you’re still using print statements to debug your App it’s time you moved to the unified OS logging framework.
Why Use Unified Logging?
Apple introduced the unified logging framework for Swift in iOS 14 but it took until Xcode 15 for it to become integrated into the debug console. Log entries include metadata to classify each entry by subsystem, category, and type, the process, and the source call site. The log type determines whether the system archives the log to persistent storage.
As Quinn explains in this Apple Developer Forums post this has some advantages:
- It’s fast so you can leave logging enabled in your released apps without worrying about performance.
- The OS persists the logs (depending on the type and configuration profile) so you can go back and retrieve them when investigating a problem.
- The logging API supports redacting of privacy sensitive personal data.
- Starting with Xcode 15, you can filter the debug console based on the log metadata.
- The macOS system console and command-line tools allow you to extract log archives or stream live logging from devices.
Adding Logging To Your App
To get started:
-
Import the OSLog framework (iOS 14):
import OSLog -
Create a
Loggerobject for each distinct area of your App you want to create logs for:public final class AppModel { private let logger = Logger(subsystem: "com.useyourloaf.LogMaker", category: "AppModel") ... }Apple recommends using something like your bundle identifier for the subsystem and a category that identifies a specific area or feature of the app.
-
Create log entries of the relevant log type (see below):
 public init() {
   logger.debug("Initialising AppModel")
 }
Log Types
There are five log types in increasing order of severity:
- debug
- info
- notice (default)
- error
- fault
The log type determines if the system writes the entry to storage. The debug log type, by default, is never persisted and the info type is only persisted if you use the log tool to collect it.
The system persists the other log types (notice and above) to an on-disk data store. The system automatically deletes old log messages based on available storage.
Since the system only stores debug messages in memory they have low overhead but you can only view them when streaming live logs in the Xcode console, Console app, or from the command-line. The system takes further steps to optimize away debug messages that you’re not viewing so you don’t need to worry about the performance impacts of debug logging.
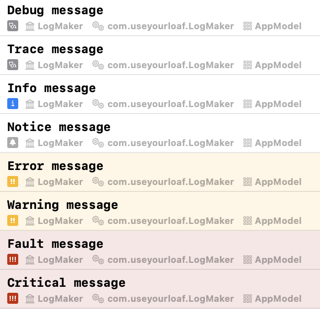
One thing I find a little confusing is that the Logger API has eight message levels. The trace, warning and critical levels duplicate the debug, error and fault levels. I’m not sure I need eight levels of severity but it was a surprise to me that error and warning messages end up being the same level in the system console.
logger.debug("Debug message")
logger.trace("Trace message")       // same as debug

logger.info("Info message")

logger.notice("Notice message")     // Default

logger.error("Error message")
logger.warning("Warning message")   // Same as error

logger.fault("Fault message")
logger.critical("Critical message") // Same as fault
Here’s how they look in the Xcode console, showing the metadata. The console highlights errors in yellow and faults in red:
I like using the scoped logging methods shown above but you can also specify the level as a parameter. The default if you omit the level is .notice:
logger.log(level: .debug, "Debug message")
logger.log("Notice message")
Formatting
Another way that Apple has made logging fast is that the message is not converted to a string until it’s displayed. The logging framework converts the interpolated string you pass to the Logger methods to an OSLogMessage. It has support for a wide range of formatting and alignment options. Some examples:
Integers
let answer: Int = 42
logger.notice("The answer is \(answer)")
logger.notice("The answer is \(answer, format: .decimal(minDigits: 4))")
logger.notice("The answer is \(answer, align: .right(columns: 4))")
The answer is 42
The answer is 0042
The answer is   42
Floating Point
let pi = Float.pi
logger.notice("The answer is \(pi)")
logger.notice("The answer is \(pi, format: .fixed(precision: 8))")
The answer is 3.141593
The answer is 3.14159250
Boolean
let enabled = false
logger.notice("Enabled: \(enabled)")
logger.notice("Enabled: \(enabled, format: .answer)")
Enabled: false
Enabled: NO
Conform any custom types to CustomStringConvertible to log them.
Privacy Levels
Non-numeric types like strings are redacted by default so that a shipping app does not leak personal information into the system logs:
public func willConnect(to sessionIdentifier: String) {
  logger.notice("willConnect: \(sessionIdentifier)")
}

public func didDisconnect(from sessionIdentifier: String) {
  logger.notice("didDisconnect: \(sessionIdentifier)")
}
will connect: <private>
didDisconnect: <private>
Note: Xcode modifies the app environment for any App it launches to remove the redaction so you will see private values in the Xcode console.
You can override the defaults by setting the privacy level on the interpolated value. You’ll want to do this to mark any strings that are not privacy related public, or to mark other data types private if they contain personal data.
For example, since my session identifiers are only UUID’s they do not identify the user so I can mark them as public:
logger.notice("willConnect: \(sessionIdentifier, privacy: .public)")
logger.notice("didDisconnect: \(sessionIdentifier, privacy: .public)")
willConnect: A75FB638-9294-436C-837F-80484AA7E412
didDisconnect: A75FB638-9294-436C-837F-80484AA7E412
If I have an integer value that is personal to a user I can mark it as private:
// var uid: Int
logger.notice("User ID: \(uid, privacy: .private)")
User ID: <private>
If you have privacy related data that you need to correlate across log entries you can convert the value to a privacy preserving hash. For example, assuming I needed to keep my session identifiers private but still correlate the connect and disconnect entries:
logger.notice("willConnect: \(sessionIdentifier,
  privacy: .private(mask: .hash))")
logger.notice("didDisconnect: \(sessionIdentifier,
  privacy: .private(mask: .hash))")
willConnect: <mask.hash: 'uZiZmp5vMXG4evDH+roSjQ=='>
didDisconnect: <mask.hash: 'uZiZmp5vMXG4evDH+roSjQ=='>
Xcode Debug Console
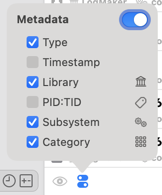
Starting with Xcode 15, the debug console also streams the system log. This means you can filter the debug console based on metadata like the subsystem, category, and type. The console hides the metadata by default. Use the metatdata options control in the bottom left of the console to change the default:
Use the search bar on the bottom right of the console to filter on the metadata or full text. For example, type “category: AppModel” into the search field to filter on the log category. (You can also start typing “App” and Xcode will autocomplete based on the entries already in the console):
![]()
You can also right click on any log entry in the console to show or hide similar entries.
With a log selected, the space bar shows a quick view of the full log data. I’m not a fan of the hidden UI, but hovering the mouse over the right edge of the console allows you to jump to the point in the source code that created the log:
![]()
Otherwise right click on an entry and select “Jump To Source”.
Console App
You’re not forced to use the Xcode debug console to view the logs. The system Console app can view archived logs or stream live logs from connected devices.
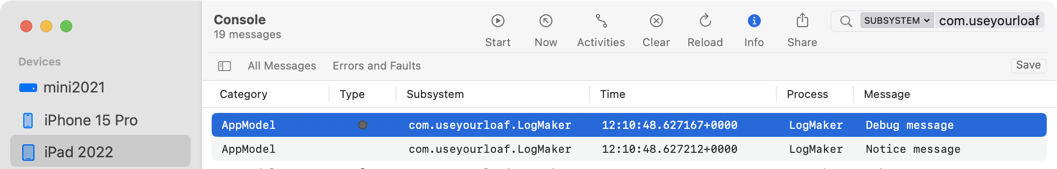
Choose the device in the left pane, add a suitable filter to the search bar to limit the console output, and then click the Start button in the toolbar to start streaming logs from the device:
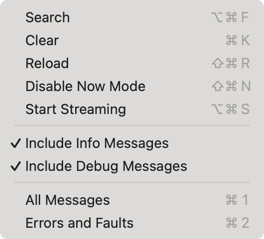
The console doesn’t show info and debug log entries by default. Enable them in the Action menu: