Xcode 13 adds column breakpoints which work like a more granular version of line breakpoints. Here’s how you use them.
Last updated: Jul 29, 2021
Setting Breakpoints
Xcode supports many different types of breakpoint but it’s the line breakpoint that I use the most. You set one by clicking in the gutter of the source code editor on the line where you want to break:

Most of the time that’s all I need, but sometimes it’s not granular enough. The debugger may step in and out of property initializers, getters and other methods before you get to the code you want to check.
What if I want to step into the largerThan method? When the debugger hits the breakpoint it stops at the countries argument of the first method (note how it’s underlined):

To reach the second method I need to step in and out of the countries property initializer and then in and out of the visited method.
Column Breakpoints
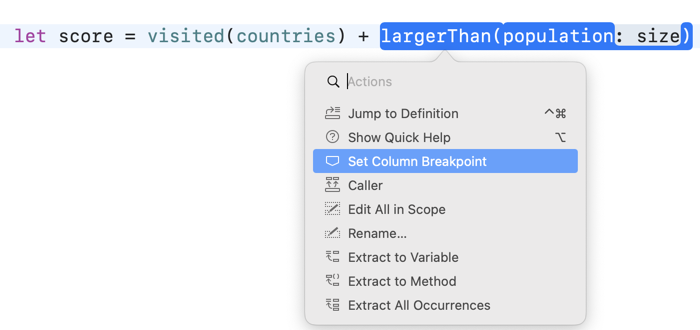
Starting with Xcode 13, we can set a column breakpoint directly on the largerThan method. Command-clicking on the symbol shows the code actions menu where you can set a column breakpoint:
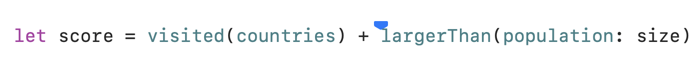
Xcode shows the breakpoint as a small carat at the column in the source code:
You can change the breakpoint in the same ways as a line breakpoint. Click on the breakpoint to enable/disable. Drag it away to delete it. Double-click to edit the breakpoint, add conditions and actions. Control-clicking on the breakpoint shows the breakpoint menu. Xcode also shows the breakpoint in the breakpoint navigator.
When the debugger hits the column breakpoint we are already at the largerThan method:

Working With Closures
In the WWDC 2021 video on breakpoints they show an example of column breakpoints working with a complex set of Swift closures. When Xcode hits the breakpoint it allows you to inspect the anonymous parameter of the closure ($0).
I’ve had mixed results getting that to work. Here’s an example. I’ve set a column breakpoint on the $0 in the last closure:

Unfortunately, the debugger never breaks at that location. I filed a feedback (FB9190264) and got a helpful explanation back from an Apple engineer:
It depends on what the compiler generates for anonymous parameters. Sometimes, the $0 would be as simple as coming from a register and hence the compiler doesn’t need to generate any code for it. In those situations, there will be no breakpoint locations that can be set.
You can see that when running my example as Xcode shows an unresolved breakpoint icon (requires Xcode 13 beta 4):

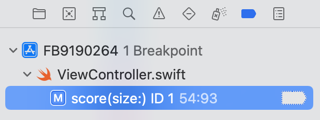
Xcode also shows the unresolved breakpoint icon in the breakpoint navigator:
Hovering over the icon shows an explanation for unresolved breakpoints:
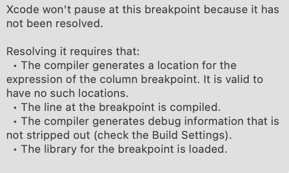
Xcode won’t pause as this breakpoint because it has not been resolved. Resolving it requires that:
- The compiler generates a location for the expression of the column breakpoint. It is valid to have no such locations.
- The line at the breakpoint is compiled.
- The compiler generates debug information that is not stripped out (check the Build Settings).
- The library for the breakpoint is loaded.