Code coverage tools are a useful way to find untested code in a project but getting them to work with Xcode was a real pain. Xcode 7 now has code coverage fully integrated making it simple to start finding untested code.
Scheme Configuration
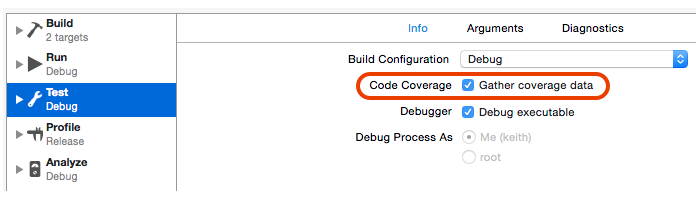
To start using code coverage add it to the Xcode scheme (Product > Scheme > Edit Scheme…). You will find it hidden in the Info tab of the Test action. If you have not already done so you may also want to add the Address Sanitizer in the Diagnostics tab.
Viewing the Results
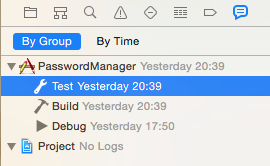
Assuming your project already has some unit or user interface tests you can find the code coverage results of a test run in the report navigator.
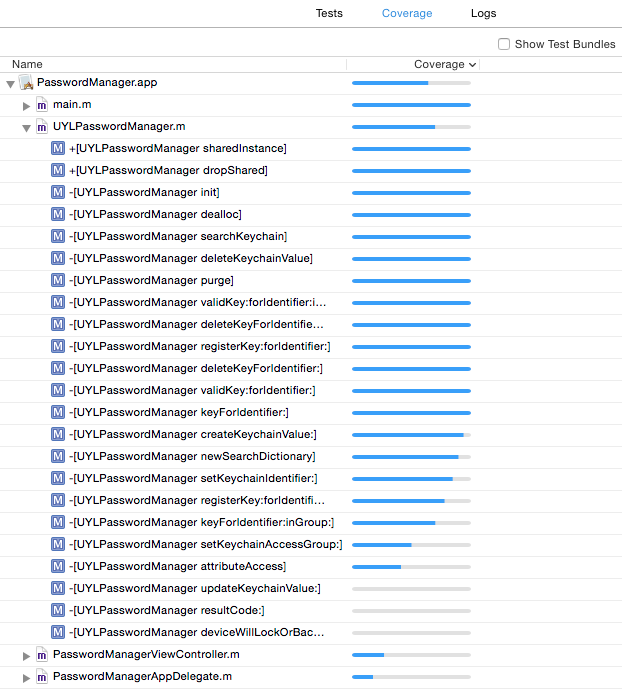
Xcode breaks down the coverage results by file and method. In this case my project only has unit tests so I am not surprised the single view controller and app delegate have poor coverage. What is a surprise is that I have some methods that my unit tests are not even reaching.
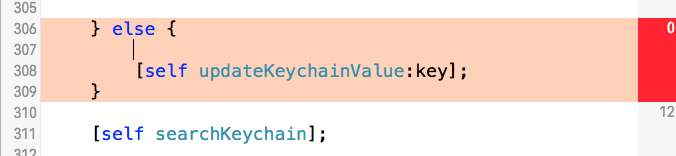
If you click on one of the methods you drill down into the code to see which paths are missing coverage. The numbers in the right hand gutter are counts of how often the tests executed that branch. Branches that were never executed show up in red making it easy to scroll down to the untested code and then write new tests to close the gap.
Code Coverage with Xcode Server
When you use code coverage with an Xcode server bot you get some more details in the log:
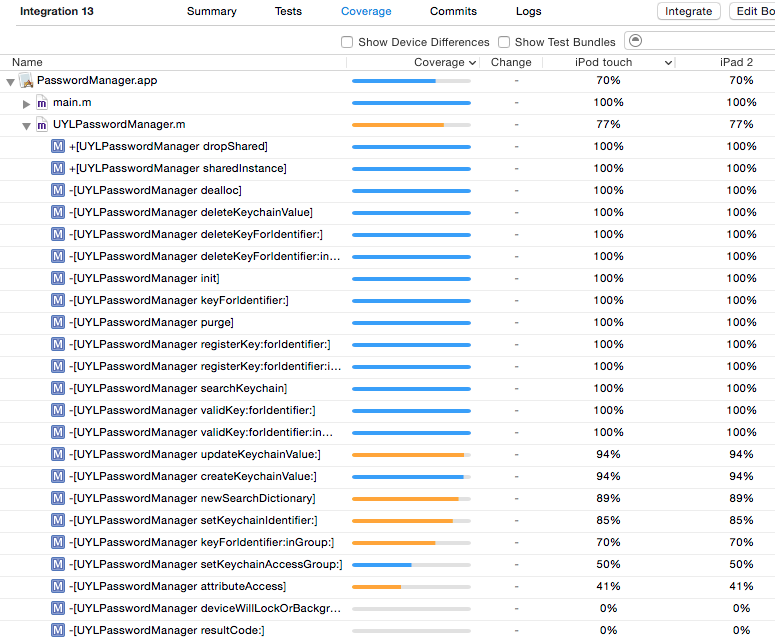
Xcode server shows the code coverage results for each tested device. It also highlights differences in test coverage between devices with an orange bar.
Note that Xcode 7 is still beta software at time of writing so there are some rough edges (such as showing orange bars when there are no device differences).