A quick follow up on yesterdays post about adding multitasking support to an iOS 4 app. I mentioned the recommendation from Apple to reduce your memory usage when entering background mode without mentioning how you determine what you are currently using.
VM Tracker
A new memory analysis instrument called VM Tracker was added to the Xcode Instruments tool with iPhone OS 3.1 to allow you to examine the virtual memory space of a process. Note that you need to be running on Snow Leopard to use VM Tracker. Unfortunately the documentation for VM Tracker does not yet seem to have made it into the Instruments User Guide so you have to look at the iPhone SDK Release Notes for iPhone OS 3.1 for details. The most interesting piece is on the Summary view:
Summary view - This view shows the total amount of memory by region type. Individual regions are grouped by region type and show their contribution to the type’s overall usage statistics. This view is primarily useful as an overview of how a process’ memory is being used, and it is recommended that special attention is paid to the “dirty” sizes, as these represent memory that must be paged to disk under memory pressure on Mac OS X and are completely unreclaimable memory on iPhone OS.
The “dirty” memory is what counts when an application is moved into the background and suspended. So this is the memory that needs to be reduced to a minimum if we want to increase the chances of surviving in the background.
To use the VM Tracker instrument run the application on a test device using the Run with Performance Tool > Allocations option from the Xcode Run menu. This will launch the application and attach Instruments to the running process with the Allocations and VM Tracker instruments.

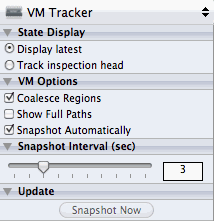
The VM Tracker tool needs to suspend the app whilst taking a snapshot of its virtual memory so by default Apple has not enabled it to automatically snapshot the app. Since we are not in this case worried about impacting the application performance we can enable the Snapshot Automatically option with the default interval of 3 seconds. Alternatively you can manually click the Snapshot Now button after the app has entered the background and been suspended to record its memory usage.
With instruments running exercise the app to get a typical memory footprint and then use the home button to send it into the background. You should see two flags appear on the Instruments timeline. The first flag indicates that your app is entering the background (applicationDidEnterBackground is called at this point) and the second indicates the app has been suspended (click on the flag for details).
![]()
Once you have a snapshot of your app in the suspended state you can examine the VM Summary view to see the DIrty Size in MB (in the final column of the first row labeled Dirty). In the example below the app is using 5.90 MB.
![]()
I am still not sure what represents “High” memory utilisation so if you try this leave a comment for comparison but my feeling is that anything below 5-10 MB is “low” (time will tell if this is a good guess). What is probably more important is to go back and check your apps memory usage from time to time to ensure that it has not dramatically increased. The final test of whether an app is using too much memory is if users start to report that the app is being terminated by the system whilst in the background. Hopefully Apple will provide some feedback in the future on how they are seeing typical apps behave.