Xcode 13 added a useful network instrument to record and analyze URL sessions and HTTP traffic.
Recording A Network Trace
To record a network trace, launch the profiler from the Xcode product menu (⌘I) and select the Network template:

There are some limitations. It requires Xcode 13 and an iOS 15 target. It also only works on a device. You cannot record a trace on the simulator. Start a recording (⌘R) and generate some network traffic:
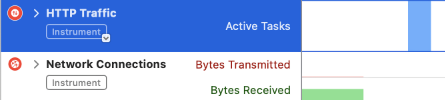
I don’t find the Instruments user interface easy to use. By default, the top track shows the HTTP traffic and the lower track shows network connections (bytes transmitted and received):
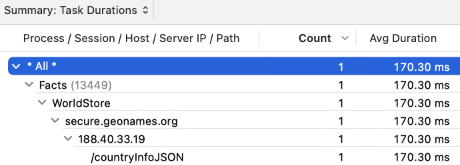
The lower detail pane defaults to a summary of the session task durations:
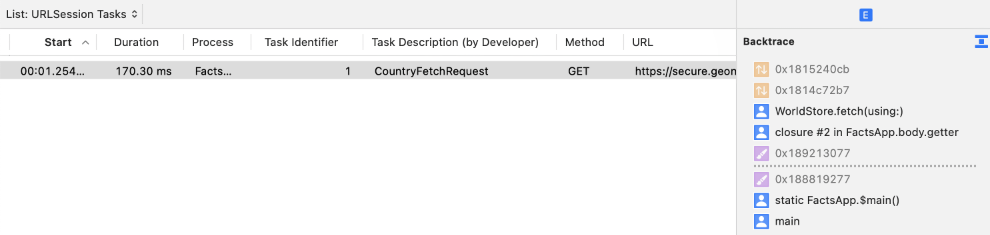
You can switch the detail pane to list URLSession Tasks or HTTP Connections. When listing tasks, the extended detail pane shows a code backtrace:
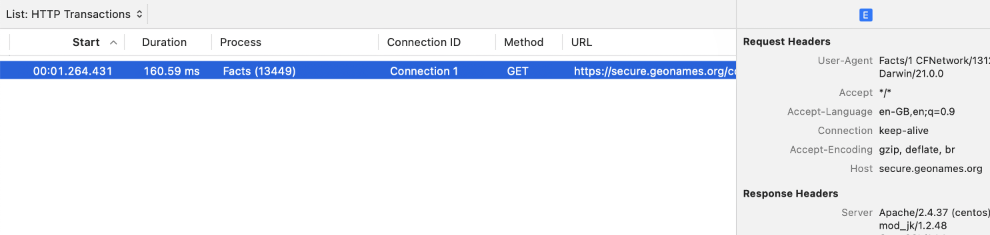
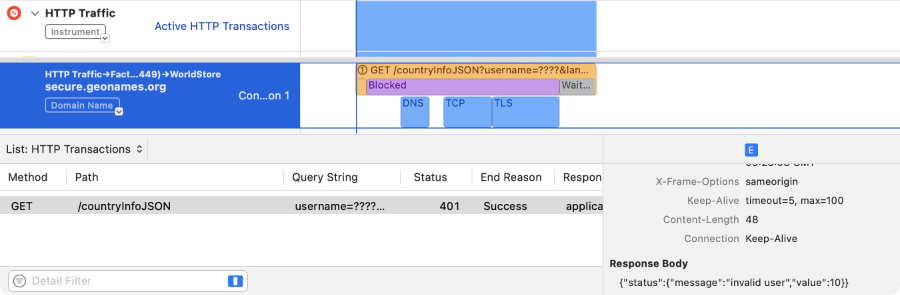
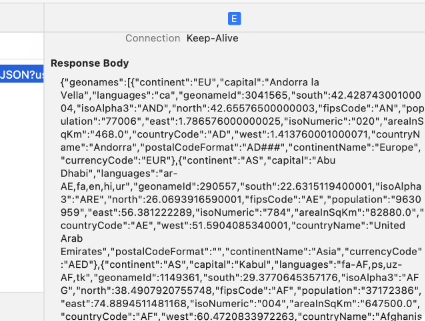
When listing HTTP transactions the extended detail pane shows the request and response headers and the response body:
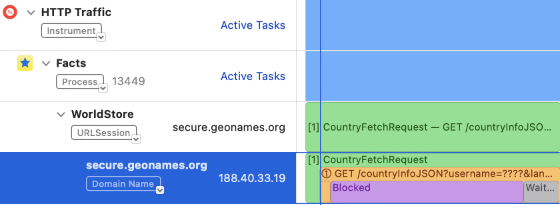
If you expand the HTTP Traffic track, it defaults to showing you URLSession tasks organised by process, session name and then domain name. Zoom in to see the task request details:
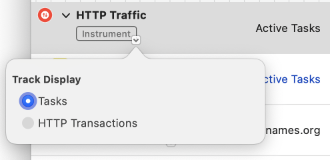
If you click on the tiny control below any of the track titles you can switch between showing session tasks and HTTP transactions:
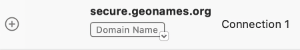
To inspect an individual track, hover the mouse over the track and click the small + button:
The track is added to the detail pane where you can then inspect the request and response. In this example my request is failing with an invalid user name:
If you’ve used third-party tools like Charles proxy you might be disappointed. You cannot modify any of the headers and viewing the headers and body is limited to what you see in the extended detail pane:
Name Your Sessions And Tasks
One big tip. Make sure you name your URLSession and tasks:
// Default Session description
defaultSession.sessionDescription = "WorldStore"

// Task to fetch country data
task.taskDescription = "CountryFetchRequest"
This makes it much easier to find and filter for specific task requests.
Sharing A Network Trace
If you need to share the trace outside of Xcode convert it to the HTTP Archive Format (HAR). Save the trace from Instruments and then use xctrace to convert the trace file to the har format:
$ xcrun xctrace export --input Facts.trace --har
The resulting .har file is a JSON file containing the HTTP connection trace information.