Updated 24-Jan-2019: Screenshot is now from Xcode 10 but otherwise this tip remains useful!
It is great that Apple shipped the core data framework with iPhone OS 3.0 but a lot of the performance and debugging tools are still missing from Xcode and Instruments. This makes trying to fine tune a slow running core data operation extra difficult on the iPhone OS.
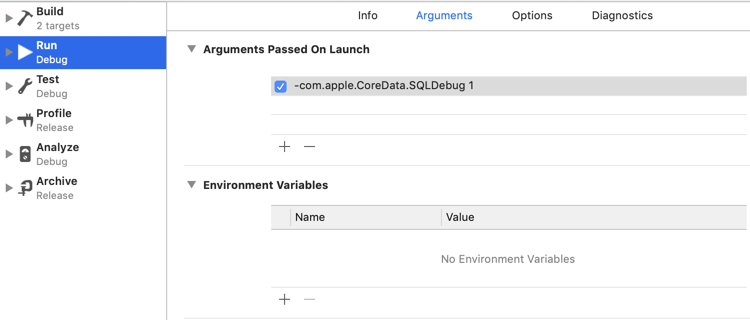
One tip I did find buried in the Core Data Programming Guide is to turn on SQL tracing. To do this you need to pass the following argument to the application:
-com.apple.CoreData.SQLDebug 1
To be clear this needs to be an argument passed to the application and not an environment variable. To set the argument use the scheme editor (Product > Scheme > Edit Scheme) and select the arguments tab for the run action:
Running the application will now log the SQL requests used by core data. This peek behind the curtain to see what core data is up to is extremely useful. Understanding the SQL queries that core data is using is half the battle in optimising performance.
For example, here is the output from CoreDataBooks iPhone sample app:
2010-03-11 19:34:19.672 CoreDataBooks[3854:207] CoreData: sql: pragma cache_size=1000
2010-03-11 19:34:19.673 CoreDataBooks[3854:207] CoreData: sql: SELECT Z_VERSION, Z_UUID, Z_PLIST FROM Z_METADATA
2010-03-11 19:34:19.763 CoreDataBooks[3854:207] CoreData: sql: SELECT 0, t0.Z_PK, t0.Z_OPT, t0.ZAUTHOR, t0.ZTITLE, t0.ZCOPYRIGHT FROM ZBOOK t0 ORDER BY t0.ZAUTHOR, t0.ZTITLE
2010-03-11 19:34:19.764 CoreDataBooks[3854:207] CoreData: annotation: sql connection fetch time: 0.0009s
2010-03-11 19:34:19.765 CoreDataBooks[3854:207] CoreData: annotation: total fetch execution time: 0.0020s for 11 rows.
It might not be as good as having the full set of core data performance instruments but at least you can see the select statement and the execution time for the fetch.