Apple suggest to aim for a total app launch time of under 400ms and you must do it in less than 20 seconds or the system will kill your app. You control what your application delegate does but how do you debug slow startup times that happen before your code is even called? Here is a tip from WWDC 2016 that might help.
Pre-main Time
A lot happens before the system executes your app’s main() function and calls app delegate functions like applicationWillFinishLaunching. Before iOS 10 it was not easy to understand why an app was slow to launch for reasons other than your own code. It has been possible to add the DYLD_PRINT_STATISTICS environment variable to your project scheme but the output was hard to figure out. With iOS 10 Apple has made the output from enabling DYLD_PRINT_STATISTICS much easier to understand.
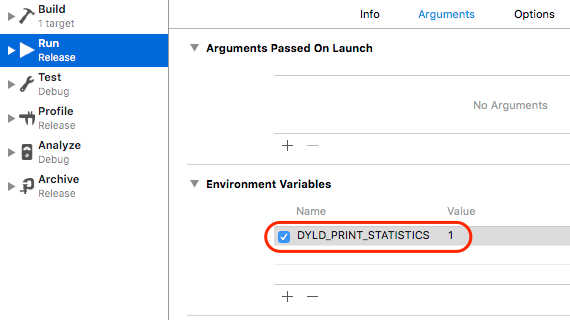
To try it out add the environment variable DYLD_PRINT_STATISTICS to your project scheme with a value of 1:
Here is a typical output for an Objective-C project running on an iPad Air 2 (using iOS 10 beta 3). The pre-main time of under 75ms is well within target:
Total pre-main time:  74.37 milliseconds (100.0%)
       dylib loading time:  41.05 milliseconds (55.2%)
      rebase/binding time:   8.10 milliseconds (10.9%)
          ObjC setup time:   9.87 milliseconds (13.2%)
         initializer time:  15.23 milliseconds (20.4%)
         slowest intializers :
           libSystem.B.dylib :   6.58 milliseconds (8.8%)
 libBacktraceRecording.dylib :   6.27 milliseconds (8.4%)
When testing for slow app launch times remember to use the slowest device you support (if you can).
The output shows you the total time taken up to the point the system calls your application main() followed by a breakdown of the main steps. WWDC 2016 Session 406 Optimizing App Startup Time goes into detail on each of these steps together with tips for improving times but here are my quick notes:
-
dylib loading time The dynamic loader finds and reads the dependent dynamic libraries (dylibs) used by the App. Each library can itself have dependencies. The loading of Apple system frameworks is highly optimized but loading your embedded frameworks can be expensive. To speed up dylib loading Apple suggests you use fewer dylibs or consider merging them A suggested target is for six extra (non-system) frameworks.
-
Rebase/binding time fix-ups adjust pointers within an image (rebasing) and set pointers that point to symbols outside the image (binding). To speed up rebase/binding time you need fewer pointer fix-ups. Apps with large numbers of Objective-C classes, selectors and categories can add 800ms to launch times (large is 20,000). If your app uses C++ code use less virtual functions. Using Swift Structs is also generally faster.
-
ObjC setup time The Objective-C runtime needs some setup for class registration, category registration and selector uniquing. Any improvements you make to rebase/binding time will also apply to this setup time.
-
initializer time run the initializers. If you are using the (deprecated) Objective-C
+loadmethod replace it with+initialise.**
After all that the system calls main() which in turn calls UIApplicationMain() and your app delegate methods get a chance to run.
Loading Frameworks Takes Time
To finish up I thought I would run a quick experiment to see how loading extra frameworks slows down launch time.
As a baseline here is the launch time for a new Swift project created with Xcode 8 measured on an iPad Air 2 running iOS 10 beta 3. I rebooted the device before each measurement to cause a cold launch with no caching of the app data in memory:
Total pre-main time: 408.97 milliseconds (100.0%)
     dylib loading time: 383.84 milliseconds (93.8%)
    rebase/binding time:   7.86 milliseconds (1.9%)
        ObjC setup time:   6.82 milliseconds (1.6%)
       initializer time:  10.36 milliseconds (2.5%)
       slowest intializers :
         libSystem.B.dylib :   2.33 milliseconds (0.5%)
It takes the system over 380ms to load the frameworks (compare that to the Objective-C example). I assume this is due to the Swift libraries embedded in the App bundle. For comparison here is what happens when I add 10 external frameworks (a selection of Swift cocoapods):
Total pre-main time: 682.90 milliseconds (100.0%)
     dylib loading time: 631.17 milliseconds (92.4%)
    rebase/binding time:  17.06 milliseconds (2.4%)
        ObjC setup time:  17.47 milliseconds (2.5%)
       initializer time:  17.09 milliseconds (2.5%)
       slowest intializers :
         libSystem.B.dylib :   6.05 milliseconds (0.8%)
The time to load the frameworks has increased from 380ms to 630ms. A not so scientific test but enough to make you think next time you load up an app with external dependencies. Try it on your apps and see how it compares.