There are a number of techniques for finding memory leaks in iOS applications including using the Build and Analyze option in Xcode and the Allocations instrument. However neither of these approaches will find memory that has been abandoned.
Abandoned Memory
To clarify what I mean by abandoned memory I mean memory that has been allocated and is still referenced somewhere in the application but that is no longer really required. Since the memory is still referenced it is not a leak so will not show up using the leak instrument. It may have been caused by some old, now long forgotten, code that is no longer required. The trick is to identify that you have some abandoned memory. A refactoring of the responsible code can then clean up the problem.
To illustrate the problem consider the following scenario. An action is triggered each time a button is tapped which allocates a number of objects. These objects are cached by the view controller because at the time the original code was developed there was an idea to reuse the objects elsewhere in the controller. However maybe the reuse never happened or the reason for the optimisation has long since disappeared but the cache remains.
A simplistic implementation of the method that is triggered by the button being pressed might look something like this:
- (void)doSomething {
  for (int i = 0; i < 100; i++) {
    NSString *textData = [[NSString alloc] initWithFormat:
                                           @"text data item %d", i];
    [self.cache addObject:textData];
    [textData release];
  }
}
Each time the button is tapped we are allocating 100 NSString objects and retaining a reference in a cache object. The cache object is just an array with a property definition as follows:
@property (nonatomic,retain) NSMutableArray *cache;
Of course, this is a trivial example just to illustrate the technique for finding abandoned memory. In practise the code may be much more complicated making it less obvious that it can be refactored.
Using the Heapshot Instrument
To run an app with the heapshot tool use Xcode and from the Run menu select Run With Performance Tool > Allocations. (Alternatively you can run Instruments directly and use it to attach to the target application running in the simulator or on a device). By default, the allocations tool shows the Statistics view, we need to switch to the Heapshots view by selecting it from the menu.
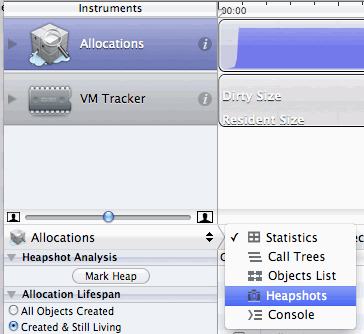
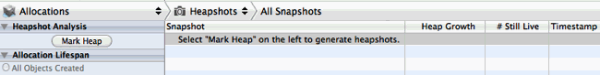
You should now see a button in the left hand pane under Heapshot Analysis labeled “Mark Heap”. Each time you use the Mark heap button a snapshot of the application heap is taken.
The useful thing about this though is that each time you take a heapshot Instruments will show you how much the heap has grown since the last snapshot and how many of the newly created objects are still live. To see why that is useful we can take a look at my dumb example app. The basic technique for discovering abandoned memory is as follows:
- Start from a known state in the application
- Generate a baseline heapshot
- Perform a series of actions to exercise the app functionality under test
- Return to the known application state
- Generate a new heapshot
- Repeat several times from step 3
My app consists of a single button which when tapped invokes the doSomething method I showed earlier (I did say it was a dumb app). So starting from the home screen of the app I will first generate the baseline heapshot with the Mark Heap button. Then to exercise the app I will tap the UI button a few times each time using the Mark Heap button to generate a heapshot:
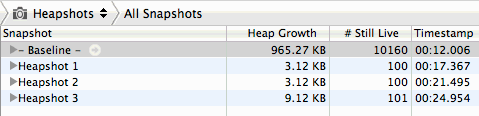
What is immediately obvious is that each time I tap the button in the app I am adding 100 (sometimes 101) objects to the heap occupying a little over 3KB. Drilling down one level into the heapshots you can see that the newly created objects are mostly CFString objects:
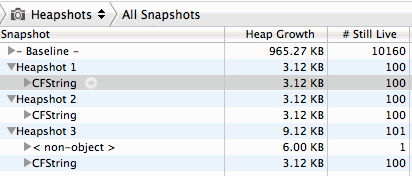
If I drill down a further level and click on one of the objects the stack trace in the right hand pane of Instruments makes it obvious that these strings are being allocated in our doSomething method:
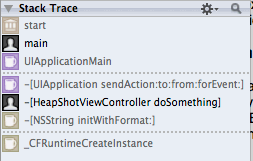
What the heapshot cannot tell you directly is if these objects should be living on once we have completed the function we are testing. However there is something suspicious about objects that get added to the heap each time we perform a function. Where heapshot is invaluable is in highlighting areas of your app that are worth further investigation. In this case pointing us to the code that is caching objects would be enough of a hint to review how the cache is being used and either fix the implementation or remove it completely if it is no longer required.